Tax Calculators Logo

US Tariff War 2025: Trump’s Trade Gambit and Its Global Impact

By: Rajiv Kapoor16 Aug 2025

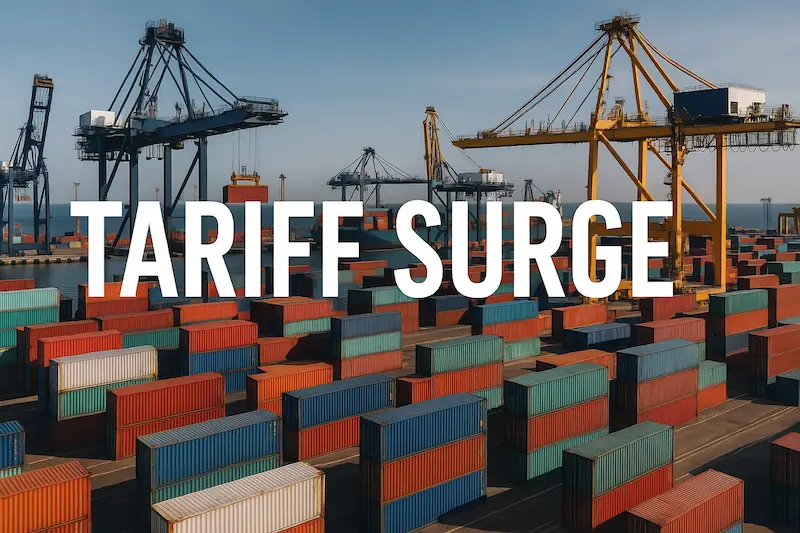
Containers and cranes at a port during a tariff surge

US Tariff War 2025: Background & Executive Summary

In August 2025, the US tariff war 2025 entered a sharper phase under Trump trade policy 2025. The average U.S. tariff has climbed close to 20%—the highest in more than a century(source: WTO Tariff & Trade Data), driven by a “reciprocal” baseline duty of around 10% on most imports, layered with targeted surcharges on metals, autos, and semiconductors. The policy signals a shift away from multilateral rules toward deal-based trade, redrawing supply chains from North America to Asia. Global monitors note rising tariff risks in 2025(source: IMF WEO Update, Jul 2025).

  • Key figure: U.S. average tariff ~20% as of August 2025
  • Headline move: Steel and aluminum duties doubled to 50%, while auto tariffs capped at 15% for EU/Japan and 10% with quotas for the UK(source: Reuters).
  • Why it matters: Tariffs function as a hidden tax on U.S. consumers, squeeze manufacturers reliant on imported inputs, and open risks—and opportunities—forIndia under “China-plus-one” diversification strategies(source: Times of India).

What Changed in August 2025: Announcements, Deals & Deadlines

As of 16 Aug 2025, three major moves define the trajectory of the US tariff war 2025: the US–China tariff truce was extended by 90 days, keeping Chinese goods at ~30% duty(source: Reuters); the scope of the 50% Section 232 steel and aluminum tariffs was widened on 15 Aug to cover hundreds of derivative products (as noted earlier); and Canada now faces a 35% tariff on non-USMCA qualifying goods(source: Reuters). In parallel, India absorbed an additional 25% duty on select exports—lifting some categories to nearly 50% total (effective Aug 27)(source: Reuters), while a Japan auto deal set tariffs at 15%(source: Reuters via U.S. News).

Tariff War 2.0 — quick timeline (Jul–Aug 2025)
DateActionWho’s affectedNotes / Source
Aug 15, 2025Scope of 50% steel & aluminum tariffs expanded (derivative codes added)Global metals(source: Reuters)
Aug 12, 2025US–China tariff truce extended 90 days (kept ~30% duties)China(source: Reuters)
Aug 1, 202535% tariff on non-USMCA goodsCanada(source: Reuters)
Jul 28, 2025Auto deals capped tariffs (15% EU/JP; 10% UK quota)EU, UK, Japan(source:Reuters · CBP TRQ)
Aug 27, 2025Extra 25% duty on select goods (some totals near 50%)India(source: Reuters)

Trump’s 2025 Tariff Framework: Baseline, Carve-outs & Enforcement

By mid-August 2025, Trump trade policy 2025 rests on a layered tariff structure: a universal 10% “reciprocal tariff” baseline effective from early April(source: Federal Register (EO 14257)), with higher deficit-linked rates (15%–41%) for many countries, in effect from Aug 7(source: Global Trade Law Blog). Sector-specific tariffs overlay this baseline:50% duties on steel and aluminum (scope expanded Aug 15, as previously reported), autos taxed at a headline 27.5% before allies’ deal caps(source: Federal Register (UK TRQ)), and semiconductors facing a ~100% tariff announcement with higher rates under discussion(source: Yahoo Finance (300% floated)).

2025 US Tariff Framework — How the Rates Stack Up (as of Aug 2025)
BucketRateCoverageStatus / Source
Universal reciprocal baseline10%Most imports (outside USMCA, Sec.232)In effect since Apr 5 (source: Federal Register)
Deficit-linked tariffs15–41%High-deficit partnersApplied since Aug 7 (source: Global Trade Law Blog)
Steel & aluminum (Sec. 232)50%Global (few carve-outs)In effect; scope expanded Aug 15 (source: Reuters)
Autos & parts27.5% → capped (EU/JP 15%; UK TRQ 10%)Auto importsDeal-capped / TRQ (source: Reuters (EU/JP) · CBP (UK TRQ))
Semiconductors~100% announced; higher under discussionImported chipsPending rollout (source: Reuters/US News)

Country Scorecard: India, China, Canada, EU, UK, Japan & Mexico

India — exposure, risks & strategic push

India now faces an onerous 50% total tariff on select exports — an initial 25% reciprocal duty from August 1, followed by another 25% penalty effective August 27 In response, New Delhi has doubled down on “self-reliance,” farmer protections and selective GST relief messaging(source: Reuters).

China — truce provides breathing space

The US–China tariff truce 2025 now runs through November 10, keeping duties near 30% and averting a threatened surge

Canada, EU, UK, Japan & Mexico — deals and carve-outs

  • Canada: Non-USMCA goods now face a 35% tariff from August 1 (USMCA-qualifying goods remain exempt)(source: White House).
  • EU: Baseline tariffs capped at 15% in the July framework; metals remain under 50% duties
  • UK: Autos capped via TRQ (in-quota rate applied; quota administered by CBP)(source: CBP CSMS).
  • Japan: Auto tariffs capped at 15% under the July deal
  • Mexico: Most trade covered by USMCA, but sectoral 50% metals tariffs still bite
At-a-glance: 2025 tariff posture by partner
PartnerHeadline TariffKey SectorsStatus
IndiaUp to 50%Textiles, gems, seafood, chemicalsActive; govt relief signals
China~30% (truce)Electronics, capital goodsPause until Nov 10
Canada35% (non-USMCA)Metals, lumberIn effect
EU15% cap (baseline)Autos, machineryDeal-based
UKAuto TRQ (in-quota rate)Autos, metalsDeal-based
Japan15% autosAutos, electronicsDeal-based
MexicoUSMCA-covered; 50% metals sectoralSteel, autosMostly exempt via USMCA

Sector-by-Sector: Metals, Semiconductors, Automotive & Supply Chains

Metals (Steel & Aluminum)

The steel aluminum tariffs 2025 at 50% now cover hundreds of derivative products after a scope expansion on 15 Aug, effective 18 Aug. That’s a win for primary mills (pricing power, utilization) but a cost squeeze for downstream manufacturers in autos, machinery, and appliances .

Semiconductors

The administration has announced a 100% tariff on imported chips and signaled options “up to 300%,” which would reverberate across electronics and autos via cost and supply risks . Policy uncertainty tends to freeze capex and reorder books; the US–China tariff truce 2025 helps short-term stability, but renewal risk keeps inventories elevated .

Automotive

Headline auto tariffs (27.5%) were capped via deals—15% for EU/Japan and 10% (quota) for the UK—curbing immediate price spikes on imports . Still, imported parts remain exposed, and 50% metals raise build costs—manufacturers may offset via trims, content localization, or staggered price increases .

Supply Chains

Companies are accelerating friend-shoring, USMCA qualification, and dual-sourcing, with pre-shipping and larger safety stocks ahead of policy deadlines. Manufacturers are also inserting landed-cost clauses and exploring product reclassification to manage exposure . Near-term, the truce with China reduces shock risk; medium-term, tariff reviews and chip policy are the wild cards.

Quick compare — selected sector tariff levers (as of Aug 2025)
SectorTariff leverWho feels it firstDownstream effect
Metals50% Sec.232 (scope widened Aug 15 → eff. Aug 18)(source: Reuters)US mills (positive), manufacturers (costs)Higher input prices; margin squeeze in autos/machinery
Semiconductors100% announced; up to 300% floated(source: Reuters/US News)OEMs & EMS; auto/electronics integratorsBOM inflation; capex freeze risk; lead-time volatility
Automotive27.5% headline → 15% EU/JP, 10% UK (quota)(source: CBP (UK TRQ); as noted above for EU/JP)Importers & dealers; parts suppliersRetail price pressure; localization push; model mix shifts
ElectronicsSpillover from chips; China truce holds ~30%Consumer devices, IT hardwareInventory padding; SKU rationalization; delayed refresh cycles
MachineryMetal inputs at 50%; component exposureIndustrial OEMsCost-plus renegotiations; CAPEX deferrals

Socio-economic Consequences: Prices, Inflation, Jobs & Growth

Baseline FY25 estimates assume current measures hold through the year:EU & Japan capped ~15%; UK autos ~10% (quota);China held at ~30% under the extended truce;Canada/Mexico largely shielded by USMCA (non-compliant lines hit); andIndia’s exposure concentrated in a small slice of exports. (Policy anchors: EU/JP/UK deals, China truce, Canada’s USMCA compliance >90%, India’s 25% add-on duties.)

  • Prices & inflation: Tariffs act as a border tax; import-cost pass-through is highest for autos, electronics, and steel-intensive goods(source: IMF).
  • Jobs mix: Primary metals gain; downstream users (autos, appliances, machinery) face higher input costs and slower hiring.
  • Trade health: WTO projects weaker merchandise-trade growth in 2025; uncertainty encourages capex delays and supply-chain rerouting(source: Reuters / WTO).
Estimated export revenue at risk (baseline FY25 if current tariffs persist)
PartnerImport base (2024)Assumed declineUSD at risk
China$462.6B (source: UN COMTRADE)~10% (share erosion; 30% tariff truce)≈ $46.3B
European Union$617.9B (source: UN COMTRADE)~4% (15% tariff cap tempers shock)≈ $24.7B
United Kingdom$68.8B (source: UN COMTRADE)~4% (autos at 10% quota)≈ $2.8B
Japan$152.1B (source: UN COMTRADE)~3.5% (autos capped at 15%)≈ $5.3B
Canada$422.2B (source: UN COMTRADE)Net ~1% (≥90% USMCA-compliant; 35% on non-compliant)≈ $4.2B
Mexico$510.0B (source: UN COMTRADE)~1.5% (most shielded by USMCA)≈ $7.7B
India$91.2B (source: UN COMTRADE)7.38% exposed × 30% decline (source: TOI / ICRIER)≈ $2.0B

Method: Import bases from official/compiled trade sources; decline rates grounded in current policy facts (China truce, EU/UK/Japan caps, Canada/Mexico USMCA carve-outs, India’s exposed share). These are baseline figures; WTO warns a collapse of truces could trigger materially larger losses(source: Reuters / WTO).

U.S. Angle: Who Gains, Who Pays, and the Net Effect

Does the U.S. gain or lose from the US tariff war 2025? In the near term, tariffs raise federal revenue and can shield some strategic industries (e.g., steel) — but most evidence shows the cost burden falls on U.S. importers and consumers, with a small drag on growth if current rates persist. Pass-through from border taxes into prices was near-complete in prior episodes, and 2025’s broader “reciprocal” regime amplifies those effects in tariff-exposed categories (autos, electronics, steel-intensive goods)(source: IMF).

  • Revenue vs. prices: Tariff receipts flow to the U.S. Treasury while firms/households face higher landed costs; prior-cycle estimates put the household burden around ~$1,300/year(source: Yale Budget Lab).
  • Jobs & manufacturing: Protection supports primary metals but raises input costs for downstream users (autos, appliances, machinery), squeezing margins and hiring.
  • Growth impact: Macroeconomic models generally find a modest net GDP drag when broad tariffs persist, after accounting for revenue, price effects, and retaliation risk(source: Tax Foundation).
U.S. gains vs. costs if current tariffs persist (baseline view, FY25)
ChannelDirectionAnchor
Tariff revenue (Treasury)Positive (cash inflow)Yale Budget Lab
Consumer/firm costsNegative (higher prices)IMF
Sector winnersPrimary metals (steel/aluminum)Reuters
Sector pressuresAutos, appliances, machineryHigher input costs
GDP (net effect)Slight drag (baseline)Tax Foundation

Takeaway: The U.S. likely sees short-run fiscal gains and select reshoring tailwinds, but most studies suggest a net welfare cost via higher prices and downstream pressures. If major truces (e.g., with China) were to lapse and rates snap back, the downside to growth and inflation would be materially larger.

India’s Angle: Exposure, Opportunities & Policy Options

India’s exposure to the US tariff war impact on India in 2025 remains selective but significant. According to ICRIER estimates, only ~7.38% of India’s exports to the U.S. are materially affected, but those lines face duties as high as 50% after the August add-on levy(source: TOI / ICRIER). The most exposed categories include textiles & apparel, gems & jewelry, shrimp, and select chemicals. Exporters have warned of margin squeezes, delayed orders, and reduced competitiveness vis-à-vis ASEAN and Mexico, which retain preferential access under alternative agreements.

Yet the current Trump tariffs India 2025 also create opportunities. Diversification intonon-U.S. markets (EU, Middle East, Africa) is accelerating, while Indian firms can pushrules of origin (ROO) optimization — shifting light assembly or finishing stages into USMCA-linked markets (e.g., Mexico) to qualify for lower duties. Policymakers are actively exploring relief channels: bilateral carve-outs, sectoral quotas, and WTO consultations. In the medium term,India–US trade war 2025 may catalyze India’s broader strategy of moving up the value chain in electronics, pharma, and digital services where tariff exposure is less severe.

India → US: exposed lines & potential offsets (FY25 baseline)
HS / SectorTariff exposureRiskOffset / Action
Textiles & ApparelUp to 50%Order cancellations, margin erosionROO via Mexico; diversify to EU
Gems & Jewelry25–40%Competitiveness loss vs. ThailandShift to Dubai/EU buyers; policy lobbying
Shrimp & Seafood30–40%US retailers cut procurementTarget Japan/Middle East; value-add processing
Chemicals & Dyes20–25%Margin squeeze on MSMEsMove into specialty/advanced grades
Electronics (phones/components)Limited direct exposureIndirect via supply chainsScale domestic production under PLI

Canada’s Angle: Shielded by USMCA, Nudged by Exceptions

Canada’s trade with the U.S. — worth over $420B annually — is deeply integrated underUSMCA, which shields the bulk of bilateral flows. That means most Canadian exports (autos, energy, agriculture) remain exempt from the Trump tariffs 2025. The new 35% duty announced in July applies mainly to non-USMCA compliant lines, such as select steel, aluminum, and niche manufactured goods(source: White House). Analysts estimate the net impact at ~1% of Canada’s U.S. exports, translating to≈ $4B–5B at risk in FY25.

For Canada, the issue is less economic and more symbolic: targeted tariffs raise compliance costs and inject uncertainty into North American supply chains. Industries most exposed are primary metals and processed lumber. Ottawa’s options includetightening ROO compliance, negotiating carve-outs, and leveraging dispute settlement panelsunder USMCA. The government has also signaled willingness to diversify exports toward the EU and Asia-Pacific while defending key domestic producers.

Canada → US: exposed lines & mitigation paths (FY25)
SectorTariff exposureRiskOffset / Action
Steel & Aluminum35% (non-USMCA lines)Higher costs; competitiveness hitUSMCA ROO enforcement; lobby for carve-outs
Processed Lumber20–30%Cross-border construction costs riseShift to Asia-Pacific buyers; legal disputes
Autos & EnergyLargely exemptIndirect risk from supply-chain disruptionMaintain USMCA compliance; diversify supply inputs

Forward Look: Risks, Warnings & What to Watch Next

The next phase of the Trump tariffs 2025 hinges on a handful of deadlines and potential policy pivots. The WTO response to Trump tariffs 2025 has been cautious, warning that escalation risks tipping a fragile global economy into a tariff war global recession. For businesses and policymakers, three watch-points stand out as critical signals through FY25:

  • U.S.–China truce deadline: Current 90-day pause holds 30% U.S. tariffs and10% Chinese tariffs until November 10, 2025; expiry without renewal could trigger a snapback to punitive levels(source: Reuters).
  • Semiconductor tariffs: Draft proposals circulated in Q3 envision levies onadvanced chips and fabrication equipment, with scope and timing under review; implementation could reshape global electronics supply chains.
  • Legal & policy wildcards: Constitutional challenges under IEEPA, WTO dispute filings, and domestic political pushback all create uncertainty on how far tariff escalation can go.

Bottom line: Businesses should track truce deadlines, tech-sector tariff scope, and legal tests as early warning signals for whether today’s disruption stabilizes — or evolves into a broader recessionary shock.

FAQs

Recalculate

It’s a renewed phase of protectionism under President Trump—often called the US tariff war 2025—where average US tariffs climbed to about 20% (the highest in a century), with sector- and country-specific hikes reshaping global supply chains (steel, autos, tech).

Trump trade policy 2025 set a ~10% ‘reciprocal’ baseline on most imports, doubled steel/aluminum duties to 50%, raised autos to 27.5% (later capped near 15% for EU/Japan and 10% with a UK quota), and floated 100–300% semiconductor tariffs to spur US onshoring.

To pursue ‘reciprocal’ trade and protect domestic manufacturing, and as leverage in geopolitics—e.g., pressuring partners linked to Russian energy—while bargaining for investment and market-access commitments from allies.

China (30% under a US–China tariff truce 2025, avoiding 145%); India (+25% add-on—some lines near 50%); Canada (35% on non-USMCA-qualifying goods); EU and Japan (~15% after deals); UK (autos near 10% with quotas); Mexico (25% on non-USMCA-compliant lines).

Steel/aluminum face 50% duties; autos saw import tariffs up to 27.5% before allied caps; electronics risk cost spikes if 100–300% chip tariffs arrive; downstream manufacturers face higher input costs and longer lead times.

Tariffs act like an import tax: costs are paid by importers and often passed through to prices. Expect pressure in steel-intensive goods, imported autos, electronics, and apparel; some estimates peg the burden near $1,300 per US household in 2025.

‘Trump tariffs India 2025’ added 25% on top of earlier duties (some lines near 50%), weighing on textiles, pharma, and IT hardware. India also gains from ‘China-plus-one’ shifts if firms diversify supply chains and India secures tariff relief on priority lines.

WTO/IMF warn of weaker trade growth and fragmentation; recession risk rises if the US–China truce lapses or broader retaliation resumes. Deals that cap rates (EU/UK/Japan) and extend truces temper—rather than remove—downside risk.

Qualify under USMCA/FTA rules of origin, diversify suppliers to tariff-lighter geographies, negotiate landed-cost clauses, seek product reclassification/exemptions, and consider FTZs or onshoring where total-cost math supports it.

A high-tariff baseline with selective carve-outs; US–China truce deadlines; the fate of proposed semiconductor tariffs; and any court or policy moves that could reset rates—key signals for prices, jobs, and global trade realignment 2025–26.